If you use or adapted the my plot.volume() function from niftiPlottingFunctions.R, please update your code with the version released 30 March 2023. This post illustrates the bug (reversed color scaling for negative values) below the jump; please read it if you've used the function, and contact me with any questions.
Huge thanks to Tan Nguyen for spotting and reporting the color discrepancy!
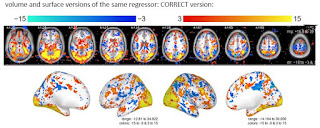
These images show the effect of the bug. These are volume and surface versions of t-statistics for a GLM regressor; a strong visual response is expected. The data was preprocessed to both surfaces and volumes, and separate GLMs run for each, so we expect minor (but only minor) differences between the two versions.
Here is the regressor plotted with the same color scaling used for both volume and surface, using the old (buggy) version of plot.volume():
The plot.volume() bug was that the color scaling was reversed for negative values (only); positive values were not affected, nor my surface plotting functions. The reversal caused the incorrect shade of blue to be used, but did not affect the thresholding: if a voxel had a value too close to zero to be colored, it was not, even with the bug. But, with the bug a voxel just over barely over the threshold (for this example, -3.01) was plotted with the strong-effect color (teal), not the expected barely-over-threshold color (dark blue).
The negative-color error is obvious now when I look at the images in this post ... but I missed it (for literally years) until Tan pointed it out. I think I missed it partly because I don't routinely view surface and volume versions side-by-side as above, but even more so because in our analyses we are pretty much always more interested in positive than negative values; I focused on the hot colors and didn't notice the illogically-bright shades of blue.
I'm pointing out this bug and my oversight since the code is public and may be used by others, but also to illustrate that everyone occasionally writes buggy code and misses weird output. More people using/reviewing code is good because it helps to catch bugs/errors/weirdness; everyone has blind spots on occasion. Especially with scientific work, if an outcome/plot/result/whatever seems strange, please ask about it - that's the way many errors are found, and errors that aren't found can't be corrected.


No comments:
Post a Comment