As we'd hope, the differences in the preprocessed images and GLM results between fMRIPrep version 1.1.7 and 1.3.2 are very small, much smaller than between either fMRIPrep version and the HCP pipeline, at both the single subject and group level. The conclusions in my previous summary post apply to the 1.3.2 results as well. Here I'll show some group results to parallel the previous summary; contact me if you'd like more of the results, more detail, or the underlying data.
First, the same 20 Schaefer parcels passed the threshold of having t > 1 (uncorrected) in all four tasks and preprocessing combinations when the fp132 (fMRIPrep version 1.3.2) results were substituted for the previous 1.1.7 results (compare with here and here):

This is not surprising, given the extremely similar GLM results for each person between the two fMRIPrep versions. Using these 20 parcels, I made some scatterplots to show the comparison in coefficients between the various preprocessing styles (the ones for HCP and fMRIPrep ("fp") are the same as in the previous summary, just with tasks overplotted; see that post for more explanation). Note that in these plots "fp132" is fMRIPrep version 1.3.2 and "fp" or "fMRIPrep" is version 1.1.7.
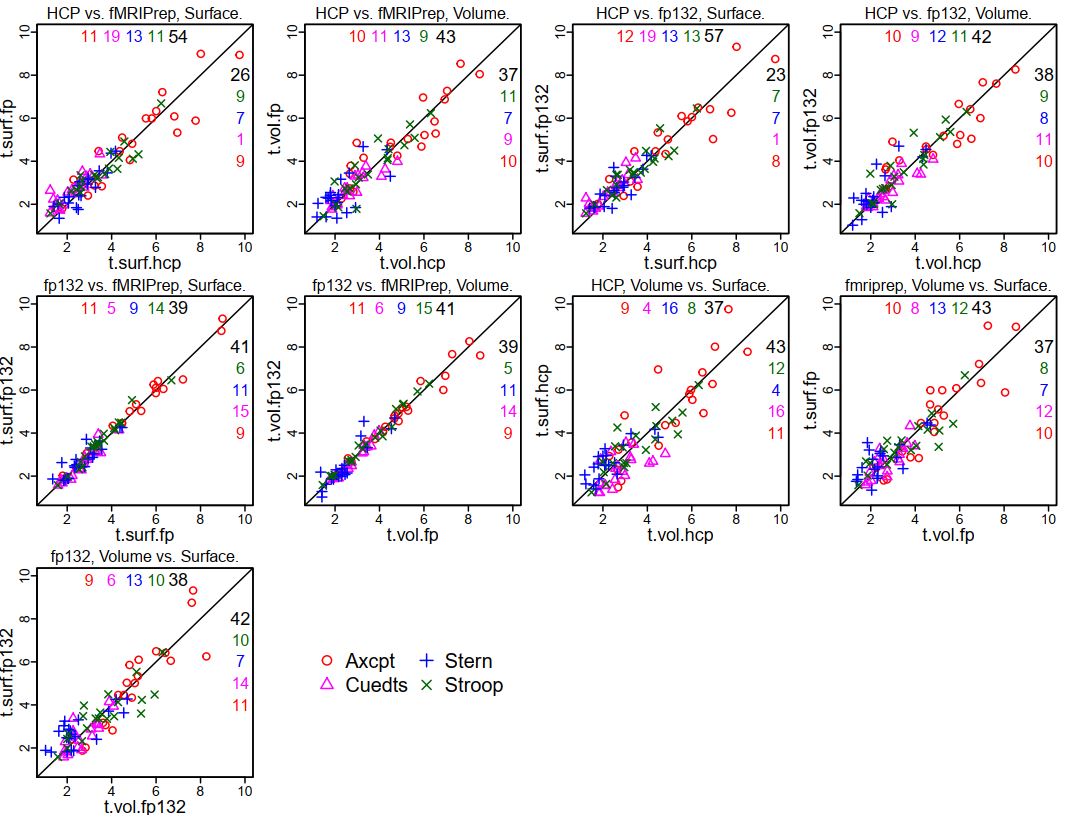
It is clear that the tightest correlations are between the two versions of fMRIPrep preprocessing, surface to surface and volume to volume ("fp132 vs. fMRIPrep"). The plots comparing "HCP vs. fMRIPrep" (1.1.7) and "HCP vs. fp132" are similar, as are the "Volume vs. Surface" plots within each fMRIPrep version.
I also set up mixed models as before, adding the fMRIPrep 1.3.2 results. The contrasts below are from a model including all four tasks, the 20 parcels, and the 13 test people, only estimating the effect of preprocessing combination on the parameter difference. I highlighted the interesting contrasts: red are volume vs. surface within each pipeline (surface better for both fMRIPrep versions); blue show that the two fMRIPrep versions were not different; green shows that the surface estimates were higher with either fMRIPrep than HCP, and volume estimates marginally higher.

So, we're still "full steam ahead" with fMRIPrep. I don't know which part of the fMRIPrep pipeline changed between 1.1.7 and 1.3.2 to make our results slightly different, but the differences don't change the interpretation of the comparisons.
UPDATE 6 September 2019: The dataset (raw and preprocessed images) we used for these comparisons is now on openneuro, called DMCC13benchmark.
UPDATE 4 January 2021: Corrected DMCC13benchmark openneuro links.
Very informative. Which XCP design did you use?
ReplyDeletefc-36p. Here's an example of the command we're using:
Deletesingularity run -B /data/nil-external/ccp/Jeffers/testSubjects/150423/derivatives:/data \
/data/nil-bluearc/ccp-hcp/SingularityImages/xcpengine-latest.simg \
-d /data/fc-36p.dsn \
-c /data/func_cohort.csv \
-o /data/xcp_output \
-t 1 \
-r /data
Where xcpengine is version 1.0 and fc-36p is the design pipeline provided by xcp-engine.