Here is the command he wrote to generate the dataset, where "mean" is what I previously called the "bias": class A is generated by a normal distribution of with mean "mean", class B by a normal distribution of mean (-1 * "mean").
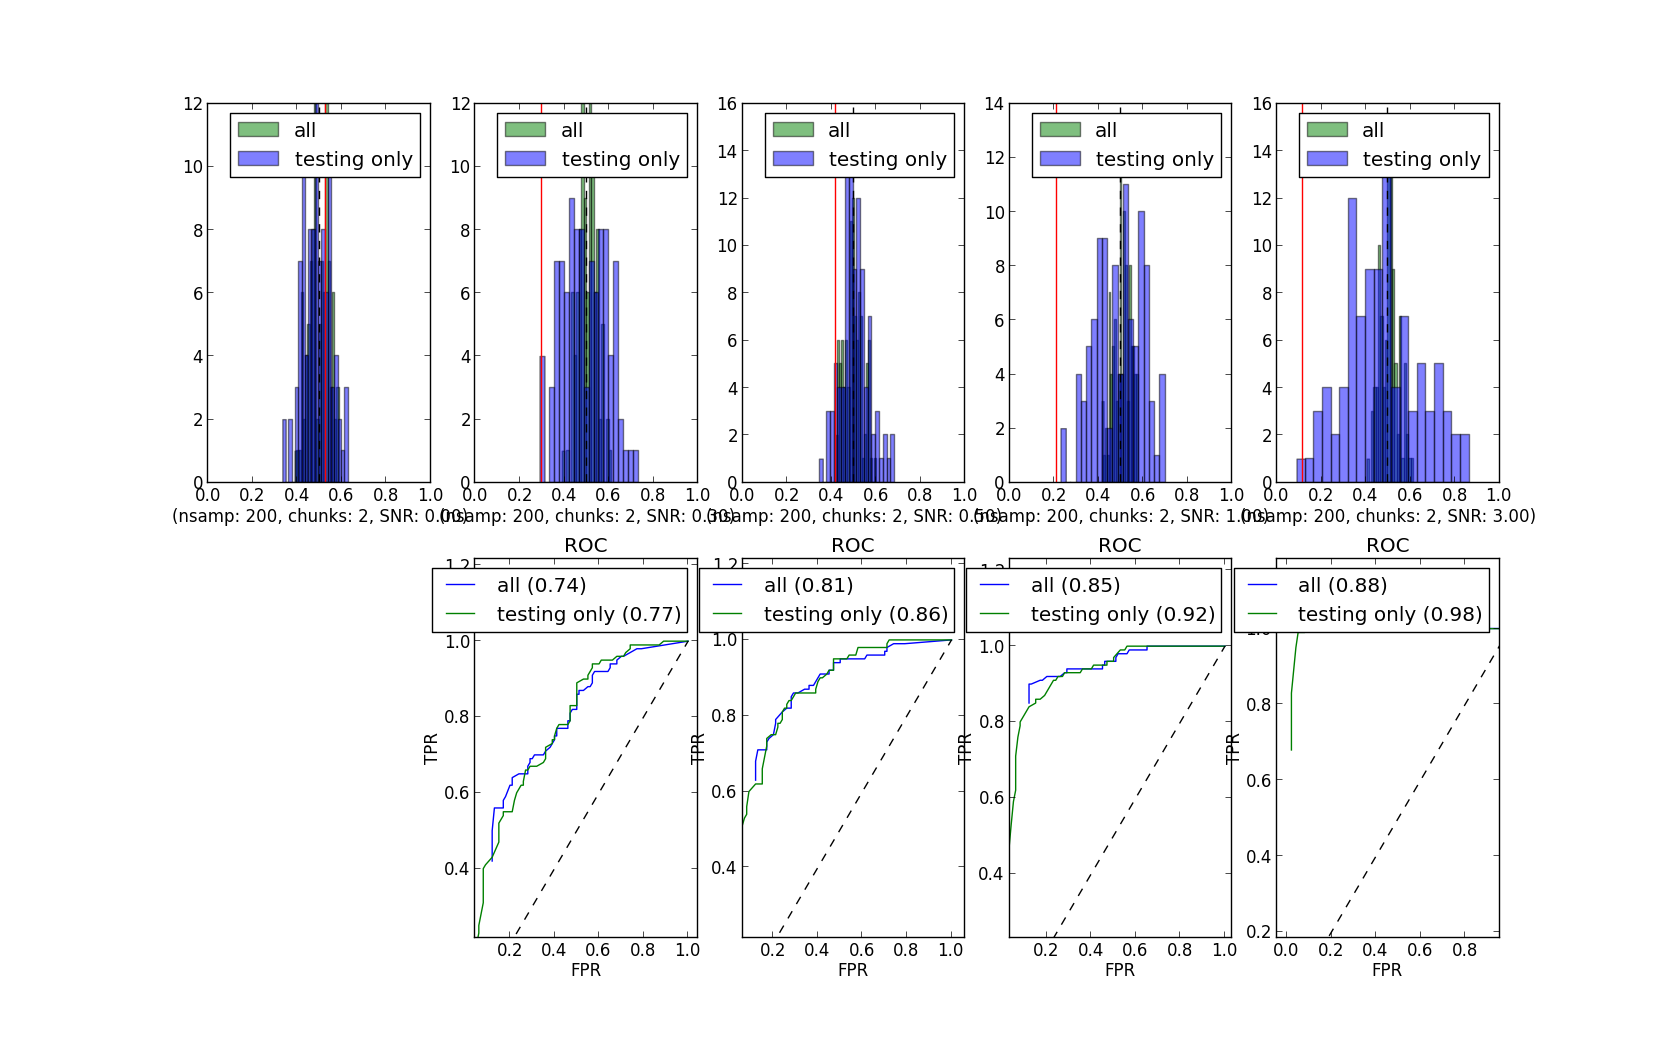
Here are the curves he generated for different numbers of examples, chunks, and means ("bias"). This is using Michael and Yaroslav's code, except for using the above line of code to generate the simulated data (and having to set "mean", and having all the voxels "non-bogus").

So, yep, how we simulate the data really makes a difference. But how should we simulate data for MVPA purposes? Do we need a few standards? I doubt any single simulation method will be sufficient.
No comments:
Post a Comment