----
In a previous post about viewing functional data from the Human Connectome Project (HCP) I described downloading the images then viewing them with the Connectome Workbench. This post describes a way to extract the timecourses for specific surface vertices using code, rather than one-at-a-time in the Workbench.
First, working with surfaces means working with GIFTI and CIFTI files. Many developers are creating functions that can read these files, but software is less mature and harder to find than for reading NIfTI files (MATLAB, FSL and NiBabel seem furthest along; I couldn't find one for R). The GIFTI library for MATLAB worked great ... except with HCP-derived files.Guillaume Flandin very kindly (and quickly!) changed his code to work with HCP files, making it ignore the spec-inconsistent part of those headers. By the time you read this, the files might be fixed, but for now (19 May 2014), if the GIFTI library for MATLAB gives you errors with HCP files (but not others),
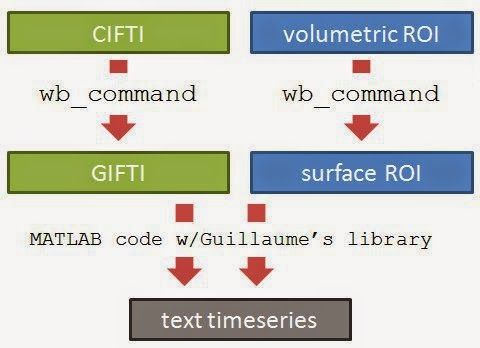
Here is an overview of the process. The logic is the simple: figure out which voxels/vertices are needed, then get the timecourses for those voxels/vertices. For HCP functional surface images there are two preliminary steps: extracting the part of the brain we want from the CIFTI file (green), and finding which vertices we want (such as by constructing a surface ROI mask, blue).
Note that it's not necessary to create a ROI to extract the timecourses; if you know which vertices you need by some other means you can read them directly in MATLAB once the GIFTI has been loaded.
unpack the CIFTI
It works best for me to think of HCP CIFTI files as archives containing the functional data for the whole brain, as a mixture of surfaces (for the cortical sheet) and volumes (for sub-cortical structures). Before reading the functional data we need to unpack the CIFTI, making GIFTI or NIfTI files, as appropriate for the part of the brain we want; the wb_command -cifti-separate program does this "unpacking" (see this post for notes about downloading HCP data, and this one about working with the Workbench wb_command command-line program). For example, if we want the functional time courses for a ROI on the left hemisphere surface, we run this at the command line:wb_command -cifti-separate in.dtseries.nii COLUMN -metric CORTEX_LEFT out.func.giiwhere in.dtseries.nii is the path and filename of an HCP tfMRI CIFTI file (e.g. tfMRI_MOTOR_LR_Atlas.dtseries.nii), and out.func.gii is the path and filename of the GIFTI we want the program to create. The command's help has more options and explanation; in brief CORTEX_LEFT indicates which anatomical structure to unpack, COLUMN gets timecourses, and -metric is because CORTEX_LEFT is stored as a surface.
identify the desired vertices
There is not a one-to-one correspondence between volumetric voxels and surface vertices in the HCP functional datasetwb_command -volume-to-surface-mapping roi.nii.gz atlas.surf.gii roi.func.gii -enclosingwhere roi.nii.gz is the volumetric ROI mask, atlas.surf.gii is an atlas surface for the hemisphere containing the ROI, and roi.func.gii is the GIFTI metric file that will be created. This only works if the surface atlas, volumetric ROI, and functional CIFTI are all aligned to the same space. For the HCP data, the MNINonLinear images for each person are aligned to the MNI atlas, specifically matching the conte69 32k atlas. Thus, I made the volumetric ROI on an MNI template brain, then used Conte69.L.midthickness.32k_fs_LR.surf.gii for the atlas.surf.gii in the -volume-to-surface-mapping call. So long as the headers are correct in roi.nii.gz (i.e. the voxel size, origin, etc are correct) the ROI should be in the correct place in roi.func.gii, but view it in Workbench to be sure.
extract the vertex timecourses
Finally, we can read both the ROI and functional data GIFTI files into MATLAB, reading the vertex indices from the ROI then saving the timecourses as text:addpath 'C:/Program Files/MATLAB/gifti-1.4'; % path to GIFTI library
roi = gifti(['d:/temp/roi.func.gii']); % load the ROI GIFTI
inds = find(roi.cdata > 0); % find is like which: get the vertex indices
wm = gifti([inpath 'out.func.gii']); % load the functional GIFTI
tmp = wm.cdata(inds,:); % get those indices' timcourses
csvwrite(['d:/temp/out.csv'], tmp); % write as a csv text file
Now, out.csv has one column for each timepoint and one row for each vertex in the ROI.
confirming the match
We can check that the values match by opening out.func.gii in both Workbench and MATLAB:
Note: I could only get Workbench to show the first two values of the timeseries if I set the little blue-arrowed button to 2; otherwise it would display only the first value. Clicking through the little blue-arrow box changes the display to different timepoints, but doesn't change the Information window that I could tell (I'm using Workbench 0.85). Note also that the "charting" interface has changed from my previous post; now you need to go through the "Chart" radio button on the upper left of the View window (right under the first tab name on my screen); I couldn't get it to write out the full timeseries in Workbench itself.
UPDATE (20 May 2014): Tim Coalson suggested that by convention the output files should be named roi.func.gii and out.func.gii, not roi.shape.gii and out.dtseries.gii as I originally wrote; I changed the commands accordingly. Tim also pointed me to the program wb_command -surface-closest-vertex, which will return the closest vertex to an arbitrary 3d coordinate. He suggests that to go the other way (from a vertex in a .surf.gii to 3d coordinates) you "could look at the coordinate of a particular vertex, and back-convert through the nifti sform to get the real-valued voxel "indices" it resides at (real-valued because it could be a third of a voxel to the right of a voxel center, etc)."
For the -cifti-separate command (and similarly for several other cifti commands), the COLUMN specifier is actually to tell it which dimension to split along - it needs to be of type BRAIN_MODELS, because that's what contains structures. The timeseries are actually along the row.
ReplyDeleteSome people find this "along column" notation to be unintuitive, but one reason it is that way is that CIFTI-2 can contain 3 dimensions, and future versions may allow even more, and "across" doesn't generalize to the third dimension, as the only remaining direction is along the third dimension.
Hi. Thanks so much for your helpful website! Made extracting surface time series from the workbench really simple!
ReplyDeleteThis may be a really simple question, but do you know if there is an easy way to extract subcortical and cerebellar time series data from the same file that you use for the surface parcellations (i.e. 'dtseries.gii')?
Thanks!
Mac
I'm not sure what you meant by "surface parcellations", but if you are referring to the out.func.gii file from the -cifti-separate example, that contains only surface data for one hemisphere. The -cifti-separate command also has a -volume option (for one structure), and a -volume-all (for all structures represented as voxels) option, which will output the volume data as nifti volume files. Similarly, it also has an -roi option to tell you which voxels have data. The -crop option is a notable difference, in that it saves space by using the bounding box of valid data, but if you need to use it with something of the original volume space, you'll need to be careful with your indices (the nifti origin information will align the cropped volume with the original volume space, so you can work out the change in indices).
ReplyDeleteFor reference, you can run any workbench command with no arguments (i.e., "wb_command -cifti-separate") to get its usage information, or browse them here:
http://www.humanconnectome.org/software/workbench-command.php
Hi,
ReplyDeleteWhat is the inpath variable here in this line?
wm = gifti([inpath 'out.func.gii']); % load the functional GIFTI
I am using gifti1.5 and get this error - Undefined function or variable 'inpath'.
Thank you.
Oh, just a string giving the path to where the out.func.gii file is located on your computer. On a windows machine, the syntax will be something like inpath = 'd:/temp/';.
DeleteOh Sorry for the stupid question previously.
DeleteThank you very much for answering my question! I truly appreciate it. I am an undergraduate student and have just started doing research on HCP.
What I really want to ask is: I now have some some MNI coordinated volume voxels(like x=-25, y=-98, z=-12), and I am also able to translate it into IJK.) --- How do I extract time course for a volume index from *.dtseries.nii?
The method you described here only works for surface data. I tried your way by doing %wb_command -cifti-separate tfMRI_EMOTION_LR_Atlas.dtseries.nii COLUMN -volume-all out1.func.gii, and use gifti to read the output, however the file was always too big and I could not read in Matlab.
Then I tried another way by using this:
data = ft_read_cifti('E:\FYP\Workbench\workbench\bin_windows64\temp\tfMRI_EMOTION_LR_Atlas.dtseries.nii');
The data I get is data =
dimord: 'pos_time'
data: [96854x176 double]
time: [1x176 double]
hdr: [1x1 struct]
unit: 'mm'
brainstructure: [96854x1 double]
brainstructurelabel: {1x21 cell}
dim: [91 109 91]
pos: [96854x3 double]
transform: [4x4 double]
dtseries: [96854x176 double]
It seems very easy for me since I only need to match my xyz with data.pos and get the dtseries of that line.
However, this does not work since the data.pos was not correct. (the result I got does not match with what I got in the workbench).
Thank you for your answer again. And I would deeply appreciate if you could help me out.
This comment has been removed by a blog administrator.
DeleteHave you tried using wb_command -surface-closest-vertex to get the vertex closest to your MNI coordinate? In the HCP data there isn't a 1-to-1 correspondence between vertices and voxels: sometimes multiple vertices might fall into one voxel, other times, just one or none.
DeleteThank you a lot! Your suggestion helps.
DeleteI have another quick question.
Do you know a simple way to draw some points on the brain? (lets see I have a list of XYZ points, how to draw them on the cortex with different colour?). Would prefer to use HCP Workbench.
Thank you a lot.
Hi, this is a great tutorial on HCP data. I really joined it.
ReplyDeleteI have a question about writing the results. Maybe you can help me.
I have extracted the timecourses from my regions of interest on the surface and performed statistical analysis on them. Then, I tried to write the results back to the surface. But I could not find the right command to do it.
Do you know anyways to write the statistics back to the surface vertex in MATLAB?
Thank you very much.
Best,
Yu.
If you're using matlab, Guillaume Flandin's library (http://www.artefact.tk/software/matlab/gifti/) should write giftis; his page shows an example.
DeleteHi Jo,
ReplyDeleteI just started my brain research project. Your tutorials have helped a lot!
I have a question here. I want to do cortex parcellation. May I know if this post is the right thing to start with in order to extract the surface time courses for HCP data?
If so, does that mean that I should look for a MNI brain as the input for roi.nii.gz inside the volume-to-surface-mapping call?
Thank you very much!
Best,
Ray.
Hi Jo,
DeleteAh~ , I just read Tim Coalson's comment. Does that mean after -cifti-separate command, the obtained out.func.gii file actually contains all the surface vertices data for each hemispheres? If so, how can I relate their indices with the corresponding 3d coordinates?
Thank you!
Best,
Ray.