My previous post described the below-chance classification part of a
recent paper by Jamalabadi et. al; this post will get into the parts on statistical inference and permutation testing.
First, I fully agree with Jamalabadi et. al that MVPA classification accuracy (or CCR, "correct classification rate", as they call it) alone is not sufficient for estimating effect size or establishing significance. As they point out, higher accuracy is better, but it can only be directly compared
within a dataset: the number of examples, classifier, cross-validation scheme, etc. all influence whether or not a particular accuracy is "good". Concretely, it is very shaky to interpret a study as "better" if it classified at 84% while a different dataset in a different study classified at 76%; if, however, you find that changing the scaling of a dataset improves classification (of a single dataset) from 76 to 84%, you'd be more justified in calling it an improvement.
The classification accuracy is not totally meaningless, but you need something to compare it to for statistical inference. As Jamalabadi et. al put it (and I've also long advocated), "We propose that MVPA results should be reported in terms of P values, which are estimated using randomization tests."{Aside: I think it's ok to use parametric tests for group-level inference in particular cases and after checking their assumptions, but prefer permutation tests and think they can provide stronger evidence.}

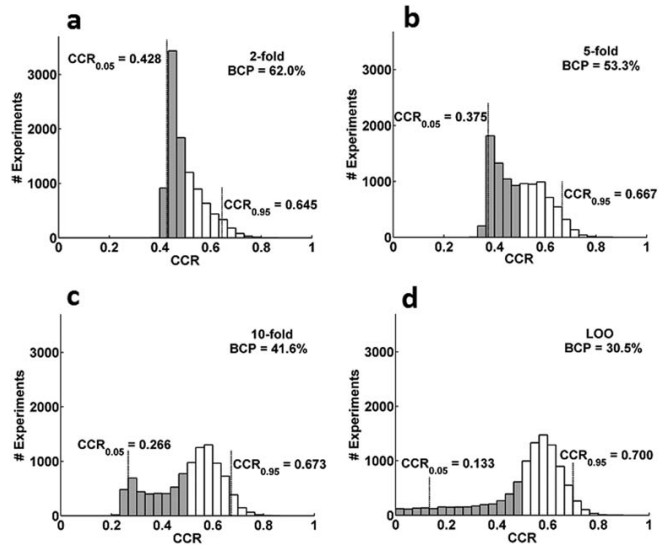
But there's one part of the paper I do not agree with, and that's their discussion of the prevalence of highly non-normal null distributions. The figure at left is Figure 5 from the paper, and are very skewed and non-normal null distributions resulting from classifying simulated datasets in different ways (chance should be 0.5). They show quite a few skewed null distributions from different datasets in the paper, and in the Discussion state that, "For classification with cross-validation in typical life-science data, i.e., small sample size data holding small effects, the distribution of classification rates is neither normal nor binomial."
However, I am accustomed to seeing approximately normal null distributions with MVPA, even in situations with very small effects and sample sizes. For example, below are null distributions (light blue) from eight simulated datasets. Each dataset was created to have 20 people, each with 4 runs of imaging data, each of which has 10 examples of each of 2 classes, and a single 50-voxel ROI. I generated the "voxel" values from a standard normal, with varying amounts of bias added to the examples of one class to allow classification. Classification was with leave-one-run-out cross-validation within each person, then averaging across the runs for the group-level accuracy; 1000 label rearrangements for the permutation test, following a
dataset-wise scheme,
averaging across subjects like in this demo.
The reddish line in each plot is the accuracy of the true-labeled dataset, which you can see increases from left to right across the simulated datasets, from 0.51 (barely above chance) to 0.83 (well above chance). The permutation test (perm. p) becomes more significant as the accuracy increases, since the true-labeled accuracy shifts to the right of the null distribution.
Note however, that the null distributions are nearly the same and approximately normal for all eight datasets. This is sensible: while the amount of signal in the simulated datasets increases, they all have the same number of examples, participants, classification algorithm (linear SVM, c=1), and cross-validation scheme. The different amounts of signal don't affect the permutation datasets: since the labels were randomized (within each subject and run), all permutation datasets are non-informative, and so produce similar null distributions. The null distributions above are for the group level (with the same dataset-wise permutation relabelings used within each person); I
typically see more variability in individual null distributions, but with still approximate normality.
I suspect that the skewed null distributions obtained by Jamalabadi et. al are due either to the way in which the labels were permuted (particularly, that they might not have followed a
dataset-wise scheme), or to the way the datasets were generated (
which can have a big impact). Regardless, I have never seen as highly-skewed null distributions in real data as those reported by Jamalabadi et. al.
 Jamalabadi H, Alizadeh S, Schönauer M, Leibold C, & Gais S (2016). Classification based hypothesis testing in neuroscience: Below-chance level classification rates and overlooked statistical properties of linear parametric classifiers. Human brain mapping, 37 (5), 1842-55 PMID: 27015748