getting the data
I found downloading the data from the Connectome database quite straightforward. You need to get an account (and agree to usage terms), but it's all quite fast. The datasets are large, so I suggest you just try one person's data to start. To do so, click the "Download Now" button under the "1 subject" box. It won't actually download right away, but rather take you to a screen where you can specify what exactly you want to download. On the second screen, click the "queue for download" buttons next to each sort of file you want. I suggest you pick the preprocessed structural data (e.g. "HCP Q3 Data Release Structural Preprocessed") and some functional data (e.g. "HCP Q3 Data Release Task Motor Skills fMRI Preprocessed"). The click the "Download Packages" button at the bottom of the page to actually start the download.I was confused the first time because the files went into Aspera Connect's default directory; on my Windows box I right-click the Aspera icon and select Preferences to see (and change) where it puts the files. This thread on the HCP-Users mailing list (and this documentation) talks about their use of Aspera Connect for the downloading.
figuring out the files: task labels and volumetric data
Once you've got the files downloaded, unzip them to somewhere handy. They'll create a big directory structure, with the top directory called the subject's ID code (e.g. 100307_Q3). If you followed my suggestions above, the functional data will be in /MNINonLinear/Results/tfMRI_MOTOR_LR/ and /MNINonLinear/Results/tfMRI_MOTOR_RL/. Two motor (and most task-type) runs are in the HCP protocol, with _LR and _RL referring to the scanner encoding direction used for each run.The tasks are described in Barch et al. 2013 (that issue of NeuroImage has several articles with useful details about the HCP protocols and data), and the onset times (in seconds) are given in text files in the EVs subdirectories for each run's data, as well as in larger files (eprime output?) in each run directory (e.g. MOTOR_run2_TAB.txt).

UPDATE (19 May 2014): The "tfMRI scripts and data files" section Q3_Release_Reference_Manual.pdf describes this a bit better.
Now that we know the onset times for each task block we can do a volumetric analysis in our usual favorite manner, using the preprocessed .nii.gz files in each run directory (e.g. tfMRI_MOTOR_LR.nii.gz). A full description of the preprocessing is in Glasser et al. 2013; motion correction and spatial normalization (to the MNI template) is included.
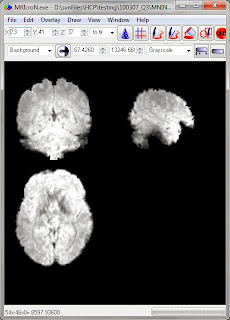
These are pretty functional images; this is one of the functional runs.
figuring out the files: surface-based
The HCP data is not just available in volumes, but surfaces as well (actually, a big focus is on surface-type data, see Glasser 2013), and these files need to be opened with Workbench programs. I certainly don't have all of these figured out, so please send along additional tips or corrections if you have them. The surface-type functional data is in .dtseries.nii files in each runs' directory (e.g. tfMRI_MOTOR_LR_Atlas.dtseries.nii). As far as I can tell these are not "normal" NIfTI images (despite the .nii suffix) but rather a "CIFTI dense timeseries file". Various wb_command programs can read these files, as well as the Workbench.
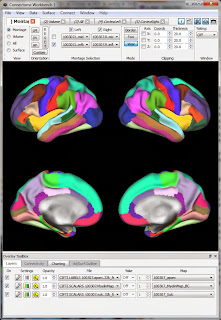
So, let's view the functional data in Workbench. My approach is similar to what I described for viewing a NIfTI: first get a blank brain (in this case, the downloaded subject's anatomy), then load in the functional data (in this case, the .dtseries.nii for a motor run). I believe the proper 'blank brain' to use is the one downloaded into the subject's /MNINonLinear/fsaverage_LR32k/ directory; there's only one .spec file in that directory. Opening that .spec file (see the first post for what that means) will bring up a set of labels and surfaces, shown at right.
Now we can open up the functional data. Choose File then Open File in the top Workbench menu, and change the selection to Files of type: "Connectivity - Dense Data Series Files (*.dtseries.nii)". Navigate to the directory for a run and open up the .dtseries.nii (there's just one per run). (aside, the "Connectivity" in the File Type box confuses me; this isn't connectivity data as far as I can tell)
As before, the Workbench screen won't change, but the data should be loaded. Switch to the Charting tab on the bottom of the screen (Overlay ToolBox section), and click the little Graph button to the left of the .dtseries.nii file name (marked with an orange arrow below). Now, if you click somewhere on the brain two windows will appear: one showing the timecourse of the grayordinate you clicked on (read out of the .dtseries.nii) and the usual Information window giving the label information for the grayordinate.


