Monday, September 5, 2016

respiration and movement: more experiences

Annika Linke, a postdoc at SDSU, contacted me, reporting that she's also seen oscillations in multiband acquisitions, with a Siemens Trio and Prisma, plus a GE Discovery. She kindly sent examples of her findings, and allowed me to share and describe a few of them here. More examples can be downloaded here and here.

Annika ran a multiband 8 sequence on a GE 3T Discovery MR750 scanner (UCSD CFMRI; TR = 800 msec, mb_factor 8, 32 channel head coil, 2 x 2 x 2 mm voxels; AP - PA encoding directions), and also saw prominent oscillations in the motion regressors, linked to respiration:

The subject was sleeping in this scan, and periodically stopped breathing. The movement in the motion regressors stopped and starts with the abnormal breathing periods, very similar to the traces from the purposeful breath-holding experiment we ran. I was also struck by the size of the oscillations in the movement regressors: somewhere between 0.5 and 1 mm, which neatly matches the size of the larger oscillations we've seen. Annika has results for an awake adult and toddlers, all of whom show oscillations (particularly in the A-P (y) and I-S (z) axes); see this pdf. These comparisons suggest the oscillation magnitude is not directly related to participant weight: the toddler and adult magnitudes are similar, though toddlers of course are smaller and have a faster respiration rate.

Here are some motion regressors Annika collected on a different scanner (Siemens 3T Prisma at Robarts Research Institute, Western University; CMRR release 10b, VD13D, 64 channel head coil, 3 x 3 x 3 mm voxels), at different MB factors. The oscillation is in all runs, though lowest amplitude with MB1.  

Finally, here's a set of motion regressors collected on a Trio at MB2 (ipat2 acceleration, 2 mm voxels, TR=1300 msec, AP/PA phase encoding directions, Robarts Research Institute, Western University). Each subplot is a run from a different person. All again have oscillations mostly in the y and z directions, though the magnitude is less than the MB8 plots above.


Annika's results make it clear that the magnitude of the oscillations in the motion regressors is not due to some weird fluke with our scanner, but rather some aspect of the multiband sequences (or some related factor, such as reconstruction, etc.); hopefully these additional examples will help us understand what's going on.

Friday, September 2, 2016

multiband acquisition sequence testing: respiration

This post is about the relationship between respiration and the movement regressors that we've found in our multiband acquisition sequence testing; see this post for an introduction; this post for examples of activation timecourses, and this post for examples from different people and tasks.

During our acquisition testing session, our participant did breath-holding for one set of MB8 runs, instead of the hand/foot/tongue movements, using the task cues to pace his breath-holding periods.

The light blue line is the respiration recording from a chest belt, with the six columns of the movement regressors overlaid, and the colored blocks at the bottom indicating task cues (as in the plots in the previous posts). Note that the time alignment is not totally perfect for the respiration trace: our system records respiration longer than the fMRI run, and I can't (yet) extract the run onset and offset signals. I aligned the traces using the breath-holding periods, but won't guarantee the timing is to-the-second perfect.

Regardless, the breath-holding periods are clear, and it's also clear that the oscillations in the movement regressors are related to the breathing. The start and stop of motion is also visible in a movie of the raw (before preprocessing) image, which can be seen here: the brain "jitters", then stops, then jitters, then stops (the movie is of the PA MOTORbreath run).

Here are two traces from the MOTOR task runs; plots for the rest of the runs can be downloaded here. The oscillations in the movement regressors is clearly closely linked to the respiration.


Interestingly, the biggest oscillation in the movement regressors here is split between several columns (dark blue, medium blue, light red), where before it was confined to one column (same participant as here); perhaps the head position or packing varied a bit?

Again, it's not new to note that fMRI is affected by breathing. What does seem different is the magnitude of the effect: these scans seem more affected, both in the motion regressors and (more importantly for us, the BOLD). For example, this last set of images shows the movement regressors for the MB0 (no multiband) runs from or test session, and a person from a different MB0 dataset ("BSF117"; a different scanner). A few blips are visible, but smaller. The MB8 and BSF117 examples below were downsampled to match the MB0 TR; note that these are the same MB8 movement regressors as above: after downsampling the oscillations no longer tightly match the respiration, but are still more prominent than the others.


multiband acquisition sequence testing: timecourses

This post is about timecourses found in our multiband acquisition sequence testing; see the previous post for the introduction and following for respiration recordings. The HCP MOTOR task is good for these tests since the expected effects are clear: left hand movement should cause strong activation in right M1, etc. The plots for one ROI are in this post; plots for hand and visual parcels in each hemisphere are in this pdf. Note also that averaging voxel timecourses within parcels somewhat corrects for the different voxel size (and presumably signal) associated with each acquisition: the number of voxels in each parcel for each acquisition is given in the plot titles (e.g., for parcel 3 below, there are 275 voxels at MB8, 180 at MB4, and 73 at MB0).

The black line in these plots is the average timecourse for Gordon parcel 3, part of the SMmouthL community, at our three test acquisitions (timecourses extracted from preprocessed images). This  parcel should be most responsive to the tongue-moving task (green blocks). Task-related activity is indeed apparent with all sequences, but superimposed oscillations are also apparent (which sort of look like the HCP data), particularly at MB8. By eye, it's harder to separate the task-related activation with the MB8 sequence, which is worrying for our event-related analyses.


Not wanting to visually mistake the difference in sampling frequency for a smoother signal, I resampled the MB8 timeseries to match the MB4 frequency, shown below (second section of the pdf). Downsampling does reduce the visual difference between the signals, but by eye, MB4 generally still has a clearer signal.


The magnitude of the oscillation varies with acquisition: greatest in MB8, then MB4, and smallest in MB0. The movement regressors (from the HCP pipelines for MB8 and MB4, from SPM for MB0) are shown in light colors on the plots (first column green, second blue, third pink). The oscillation in the activation timecourses looks to be clearly related to the oscillation in the movement lines, which in turn is related to respiration (examples of respiration recordings in the next post, as well as this previous post). An effect of respiration on BOLD is expected and known for a long time; the problem here is that the effect seems larger in magnitude, and perhaps higher in MB8 than MB4. By my eye, the magnitude of the oscillation doesn't appear totally consistent effect across the brain, making it potentially harder to model out post-processing; but this variation is simply my impression so far.

I'm happy to share volumes, etc. if any of you have ideas for additional analyses or want to explore further, and appreciate any thoughts. The preprocessing pipelines also generated surface versions of the files, which I am unlikely to be able to look at any time soon.

multiband acquisition sequence testing: introduction

In the previous couple of posts I shared some strange-looking motion regression curves, which turned out to be related to respiration. I also posted examples of average voxel timecourses which I've been looking at to get a feel for the task-related signal in these images, and how it might be impacted by the respiration-related oscillations. Task-related signal is of primary importance to us (e.g., MVPA and FIR analyses), and ideally analysis of single events. So, everything here is through that lens; implications for resting state, functional connectivity analyses, etc. are likely very different, and I'm not going to speculate on that at all.

We've done a lot of analyses this week, and people have been kind enough to share some of their data and thoughts. This is a lot of material and fairly preliminary, but I think will be of great interest to people using multiband sequences and/or HCP data, so I'll put a few posts together, rather than trying to fit everything into one.

Last Sunday we ran a series of test scans, using as participant the lab member with the most prominent oscillations (examples of which are shown here), and the HCP MOTOR task. This task is short (just over 3.5 minutes long), and has blocks of right or left hand movement, right or left foot movement, and tongue movement. I showed example timecourses from the HCP in the previous post; the graphs from our test runs (see this post) are the same, except that I color-coded the task blocks by body type for easier visibility.

We ran three main test sequences, plus a few variations. Acquisition details are below the fold. The three main sequences were:
  • MB8: The same multiband 8 sequence we've been using (described here), except with LeakBlock enabled. TR = 800 msec, acquired voxels 2 x 2 x 2 mm.
  • MB4: A new (for us) multiband 4 sequence. TR = 1200 msec, acquired voxels 2.4 x 2.4 x 2.4 mm.
  • MB0: A control, non-multiband sequence, the ep2d_bold built-in scanner sequence.TR = 2500 msec, acquired voxels 4 x 4 x 4 mm.
Preprocessing was through the HCP pipelines for the multiband sequences, through SPM12 for the control (realignment and spatial normalization; voxels resampled to 3x3x3); motion regressors plotted (here) are as generated by those programs. I generated voxel timecourses as described before, using afni and the Gordon parcellation for ROIs. We have respiration belt recordings for the multiband sequences, but not for the control.

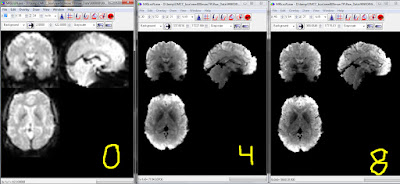
The functional images we collected with the multiband acquisitions are beautiful. The screenshot above shows a frame from an AP run of each type (the second left-hand movement block, to be precise), before (top) and after (bottom) preprocessing. The MB8 functional images practically look like anatomical images, there's so much detail.

The next few posts will get into the respiration and activity timecourses we found in each.

acquisition details for MB4 and MB0 below the jump; see the previous post for MB8.